Good question! When it comes to data intel on an organisation's performance, less is not more! Being able to accurately record and evaluate data across your personal QI project or across your entire organisation resulting in better, data-driven decision-making, could be the difference between you achieving your objectives or falling at the first hurdle.
Lets look at the detail ...
What is Statistical Process Control (SPC)?
Statistical Process Control (SPC) is the scientific, analytical method used in industries such as healthcare and manufacturing to record data and monitor a process over time. The key is to begin monitoring the process using SPC before you implement a change. This will then allow you to measure the success of that change and confirm whether or not any significant improvements have started to surface.
SPC softwares have revolutionised the way in which visual information is produced in the form of Run and Control Charts. For many years there has been a high expectation that the person creating the charts fully understood the detailed calculations behind the chart types which hasn't always been the case, resulting in error. Also with time becoming a limiting factor in many roles, the need to manually work out formulas for charts is deterring people from recording their data in this way. This is why using a quality improvement system to calculate the charts for you is on the rise.
The difference between Run Charts and Control Charts
Run Charts and Control Charts are two basic quality control tools with varying reporting abilities:
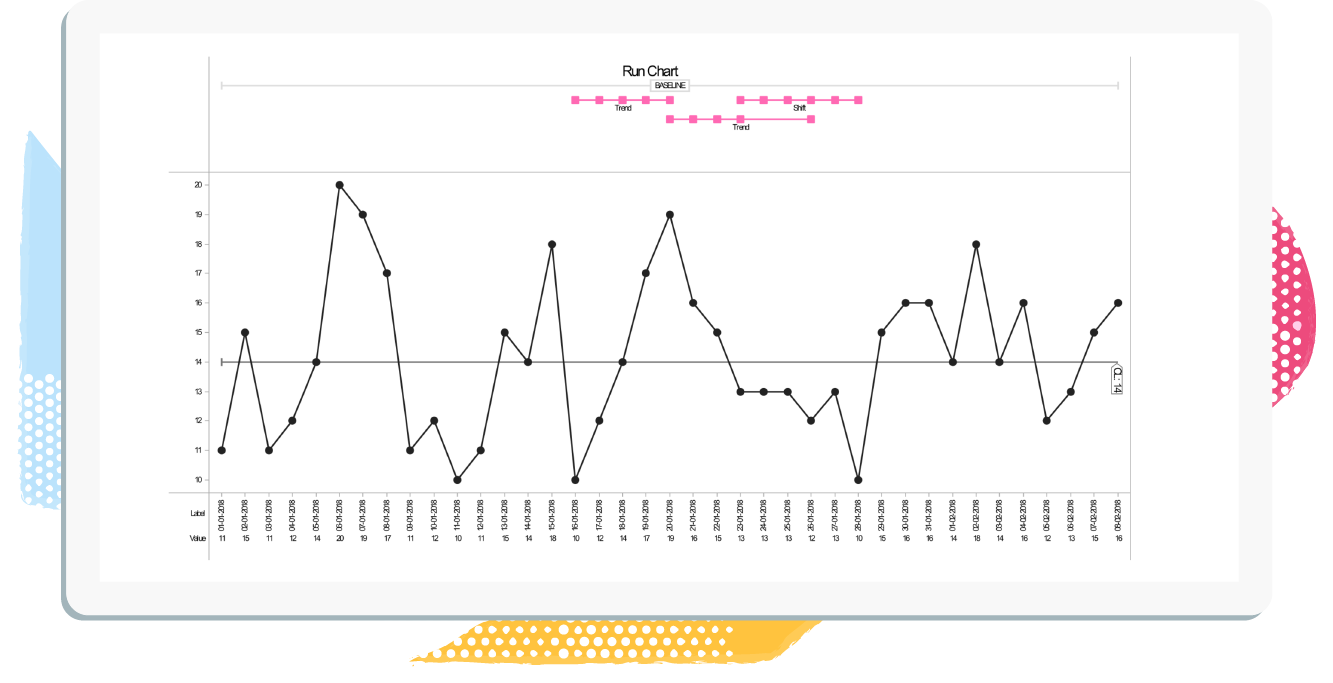
Run Chart
The run chart is one of the simplest charts to use but still provides valuable information. Essentially it's a line chart of data plotted overtime with rules applied to identify if the process is stable. The continual plotting of data enables you to uncover trends (upward and downward) and patterns in your process or system.
Control Chart
A control chart is a more advanced version of a run chart. You may hear this chart referred to as a Shewhart chart. Whilst this chart still plots a single line of data, it also displays upper and lower control limits. These lines allow you to identify the difference between normal and unusual variation in data and also whether the variation is positive or negative.