
Start improving with Life QI today
Full access to all Life QI features and a support team excited to help you. Quality improvement has never been easier.

Organisation already using Life QI?
Sign-up

Measurement is a critical part of testing and implementing changes; measures tell you whether the changes you are making are actually leading to improvement. With the right set of balanced measures and good data collection, there will be no guesswork in your improvement work.
An effective measurement plan is more than a list of measures. There are a number of important aspects that need defining for each measure and together will form your plan.
These include:
To help you shape an effective measurement plan we have outlined some key considerations for defining your measures and the supporting elements …
Whilst there are similarities there are important distinctions between measuring for improvement and measuring for judgement (attainment of goals/KPIs) or research (attaining new knowledge). Sample size is one area where these types of measurement vary. Within improvement science we are looking for ‘just enough’ data to make statistically robust judgements on variation. This will usually mean small sequential samples, and not require a whole population sample size.

Improvement projects should have a relatively small, representative set of measures that are tracked over time.
The starting point is usually to identify a measure(s) that will allow you to determine if you realise your improvement aim. This will be your outcome measure. You may only have outcome measure, and it is not wise to have many outcome measures, this may indicate your overall aim is too wide reaching.
You should also include at least one process measure and one balance measure.
Process measures focus on the things that have to happen reliably to achieve the desired outcome. Whereas balance measures look for possible consequences of your changes elsewhere in the system. Read more about the types of measures and why you need all three types.
To start developing ideas for your measures:
Check what you have come up with – are they specific measures or concepts? For example, ‘staff experience’ is not a measure, it is a concept. A measure for this concept might be ‘% of staff who report they had a good day’.
There are many options of what to measure for each concept, so you need to consider what is most appropriate for your project, and what data you can actually get hold of. There is no point having a measurement plan full of measures you can’t collect data for. Do not underestimate how challenging and time consuming this step can be.
It can be tempting to measure as much as possible, but this could reduce the time spent testing, implementing and spreading changes. The aim is improvement, not measurement! Only measure what is valuable and try to keep it as straightforward as possible.
In general, a small set, say 5 to 8 measures is likely to be about right for most improvement projects.

It is vital to have well defined measure and that the data collection plan for each measure is also clear and understood. Uncertainty in the definition and collection and introduce variation that masks the true performance of the system you are seeking to improve, making your judgement of impact unreliable.
According to NHS Education for Scotland the qualities of a good measure include:
Now that you have put a name to each of your measures it is time to shape the supporting elements for each measure …
Describe your measure, in quantifiable terms, and include what to measure and the steps to follow to measure it consistently. This should be as detailed as possible and define the data items you need to produce the measure, how the measure is calculated using the data collected, and which sample groups are to be included and excluded.
Provide a detailed description of how and when the data will be collected, and by whom.
The data collection plan should cover:

When defining your measures, you will need to identify what type of data will be recorded for each measure. For example, would the measure be best expressed as a percentage, a rate, a count? The type of data used will also influence the chart type used to display that data.
Check out our handy decision tree for identifying data types and the appropriate chart types.
Generally, the advice is to collect data as often as possible. This will allow you to build up a representative data set (the baseline) as quickly as possible; following which you can then start testing changes and observing the results against your baseline.
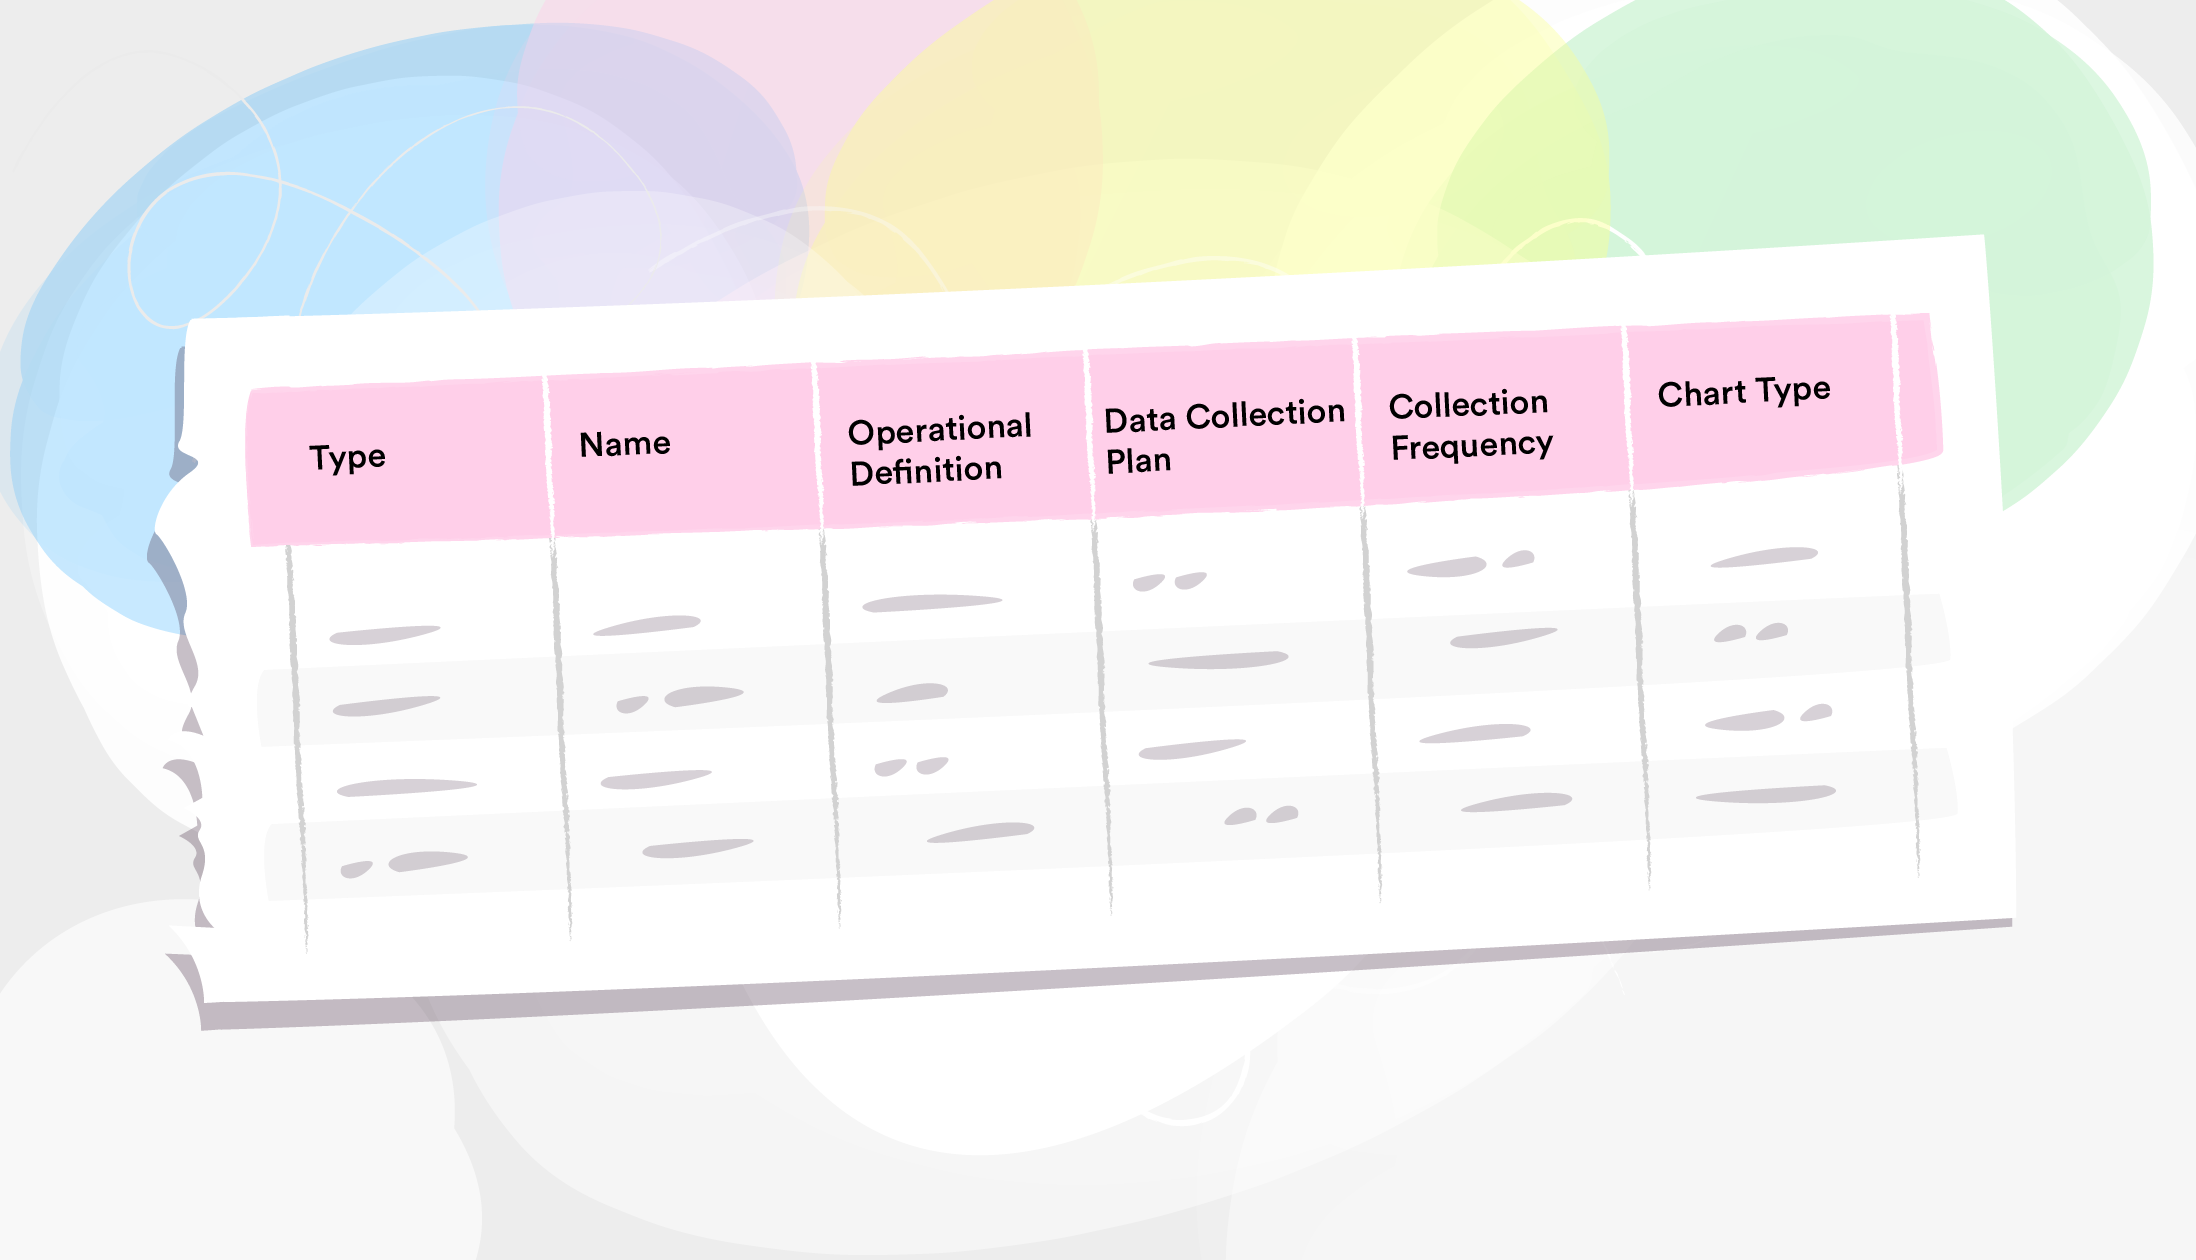
So now you know everything you need to about what measures you need, how to define them and how to collect and visualise the results. Time to write this up into a clear measurement plan. This example plan illustrates how you can bring all these elements together …
Full access to all Life QI features and a support team excited to help you. Quality improvement has never been easier.
Organisation already using Life QI?
Sign-up